
Chapter 4: Inventory Looked Accurate—But Sales Told a Different Story

For the first time in months, Sam wasn’t worried about pricing. Across all five stores, prices were aligned, margins had stabilized, and daily adjustments were no longer consuming his time. It finally felt like control was returning to the business.
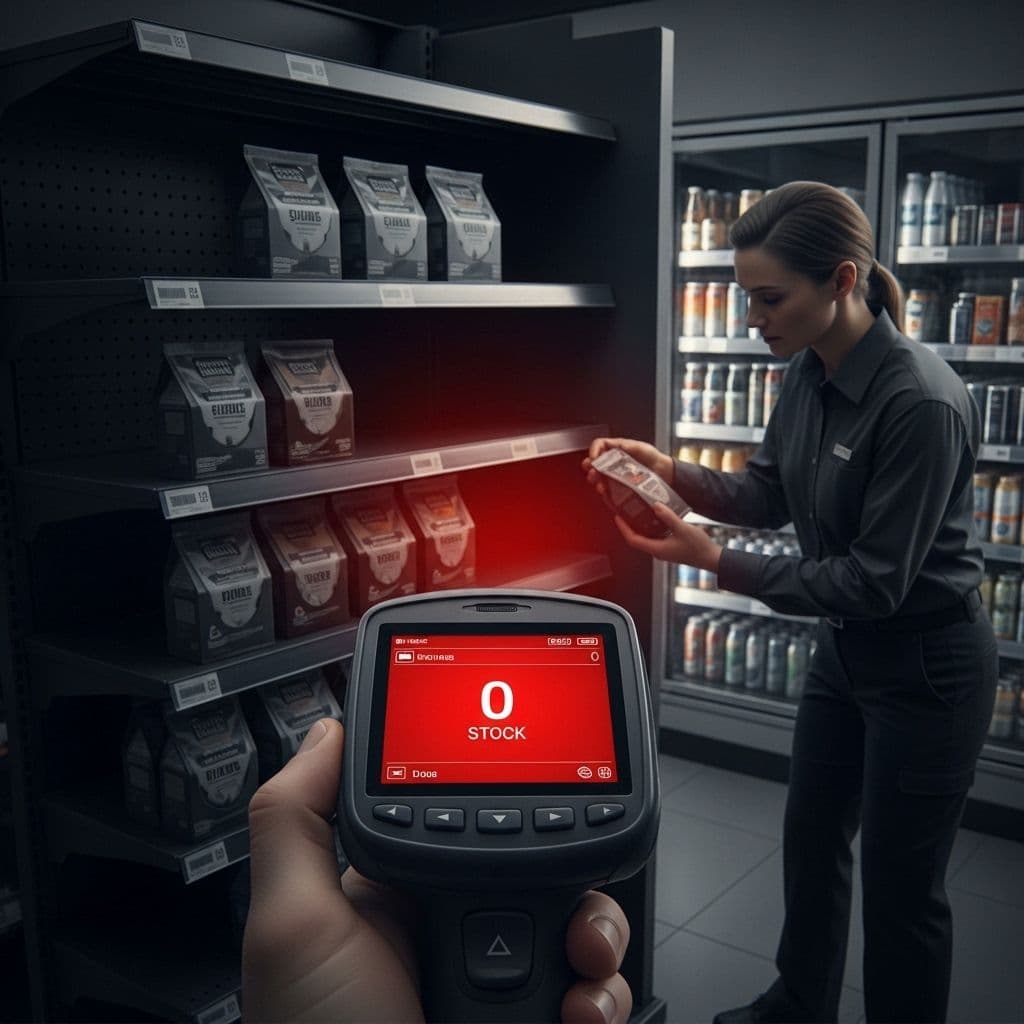
But inside the stores, something didn’t add up. Products that should have been available weren’t on the shelf, while items that barely sold kept appearing in new orders. The reports looked clean and consistent, yet the actual store experience told a different story.
Sam didn’t have a pricing problem anymore. He had something harder to see.
The system said one thing — The store said another
At first, the issue seemed minor. The system showed inventory clearly, and nothing suggested a serious problem. On paper, everything appeared aligned across stores.
But daily operations told a different story. Products marked as available weren’t physically present, and what seemed like a small delay kept repeating. The same gaps showed up again and again.
Sam began verifying things himself, comparing shelves with system data. That’s when the pattern became clear: the system reflected recorded stock, but not actual availability.
What looked like a small inconsistency wasn’t temporary. It was structural.
Why small inventory gaps started compounding across stores
What started as small inconsistencies quickly scaled. A missing unit in one store didn’t seem critical, but across five stores, repeating over multiple cycles, those gaps began to compound.
The issue wasn’t the size of each error—it was the repetition. The same products showed mismatches, the same corrections were made, and nothing improved.
Without a system to connect these gaps over time, each issue was treated as isolated. In reality, they were linked. These small discrepancies quietly built into a larger operational problem.
Patterns don’t break on their own. They scale until they’re addressed.
When inventory errors start driving the wrong decisions
The real impact wasn’t the mismatch itself—it was the decisions built on top of it. Ordering was based on system data, not actual shelf conditions. Products that appeared in stock were skipped, even when unavailable, while slow-moving items continued to be reordered.
Shelf space followed the same logic. High-demand products lost visibility, and low-performing items remained in place.
Over time, this affected both revenue and cash flow. Missed sales increased, capital stayed tied up in non-performing inventory, and efficiency dropped across locations. Inventory errors didn’t stay operational. They became financial.
More counting didn’t fix it — it repeated it
To regain control, Sam increased audit frequency. Inventory was counted more often, discrepancies were recorded, and adjustments were made after each cycle. But the same issues returned.
Each audit showed what was wrong, but none explained why it kept happening. The effort increased, but the outcome stayed the same. As the business scaled across multiple stores, manual checks and periodic counting couldn’t keep up with the pace of inventory movement.
The system provided snapshots, not continuity. Counting showed the problem. It didn’t solve it.
Why the same inventory errors kept repeating — until sam saw the pattern
Sam began analyzing a simple but recurring scenario across his stores to understand where the inconsistency was coming from.
In one case, a store received 12 beer packs (each 12-pack bottles). Over time, 7 packs were sold, so the expected remaining inventory should have been 5 packs. However, when the system was checked at the time of placing the next order, it showed zero available stock for that item.
Based on that system data, the store placed a new order for 12 packs. When the delivery arrived, the physical inventory revealed something different: there were already 5 packs present on the shelf, which brought the actual stock level to 17 packs.
And this is also why traditional inventory audits are failing convenience store owners often fail to solve the problem. They highlight mismatches, but don’t explain how those gaps were created in the first place.
That’s when the underlying problem became clear: the system did not fail at counting it failed at capturing what happened between those counts.
What actually changed after stock 360 revealed the real inventory picture
Before this shift, Sam’s decisions were based on partial visibility. Inventory was counted and corrected, but not fully understood. The system showed stock levels, but not how products moved through the store.
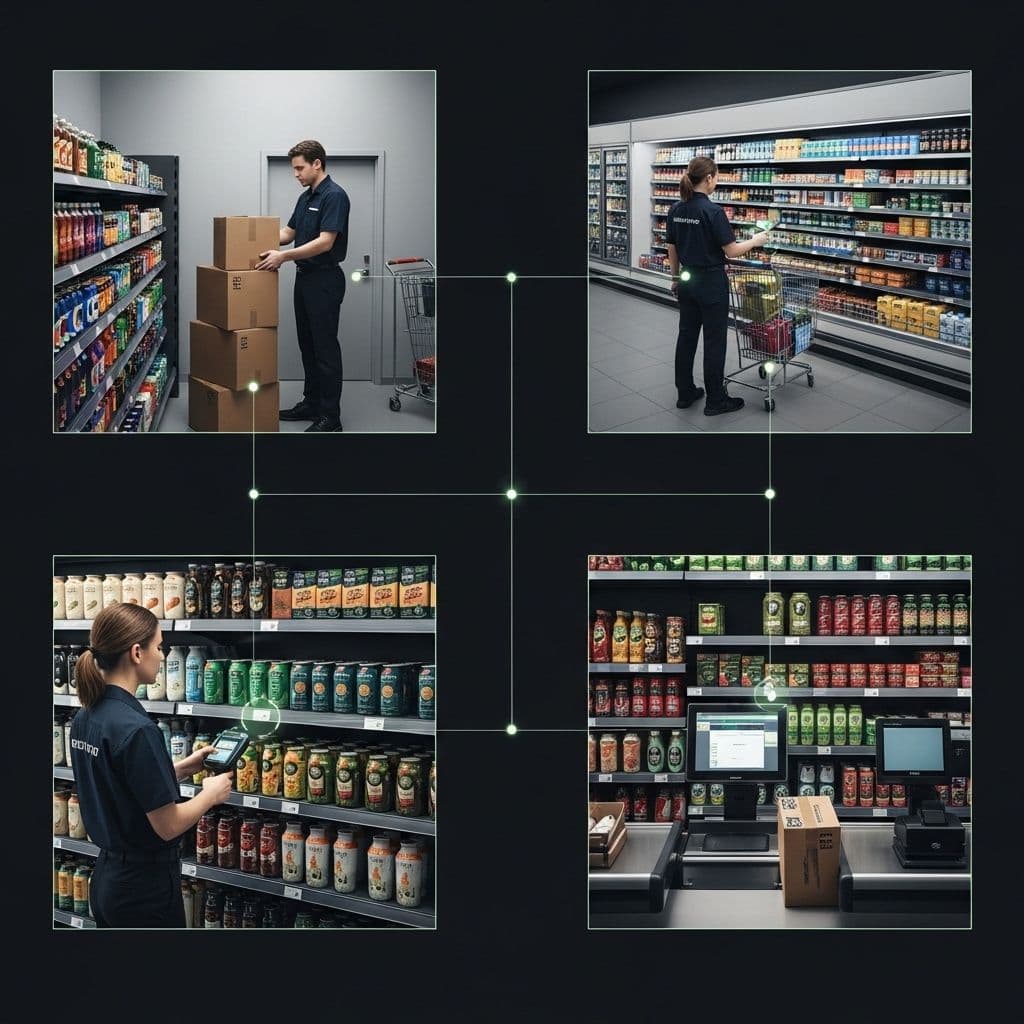
Stock 360 changed that approach. Instead of periodic counting, inventory was tracked across its full journey—from receiving to shelf placement to final sale. Each product was scanned and verified, aligning physical stock with system data.
For the first time, discrepancies became traceable. Missing products, slow-moving items, and high-demand products were clearly identified. The focus shifted from correcting numbers to understanding behavior.
The biggest impact came after the audit. Sam gained a structured view of inventory—what was selling, what wasn’t, and where inefficiencies existed. Ordering decisions became more accurate, shelf space was optimized, and operational focus shifted toward high-performing products.
For the first time, the system matched the store. Inventory didn’t become easier. It became explainable.
Inventory control became a driver of margin growth
As inventory became structured, the financial impact followed. Fast-moving products remained available, reducing missed sales, while slow-moving inventory was reduced, freeing up both space and capital.
Ordering became more precise. Sam wasn’t increasing spending—he was allocating it more effectively toward products that generated consistent returns.
Stock turnover improved, cash flow became healthier, and decisions were made with confidence rather than assumption. Inventory stopped acting like a hidden cost. It became a driver of growth.
Final Thought: control didn’t come from effort — it came from structure
Looking back, Sam realized the issue was never about effort. The limitation was the system—it showed data, but didn’t create control.
That changed when he implemented Stock 360. Instead of relying on periodic counts and assumptions, he finally had a structured way to understand how inventory actually moved across his stores.
Once that shifted, everything followed. Decisions became reliable, operations became predictable, and inventory no longer required constant correction. Because inventory problems don’t stay hidden—they show up in missed sales, incorrect orders, and uncertainty in daily decisions.
The difference wasn’t working harder. It was finally working with clarity.
- If pricing still feels inconsistent, revisit how Sam fixed margin control in Chapter 3.
- And if you want to see how full store operations come together beyond inventory, continue to Chapter 5.

ITC's Coconut Cola Isn't Just a New Soft Drink—It's a New Retail Category. Is Your Store Ready to Measure It?
4 Key Lessons Convenience Store Operators Can Learn from Pump & Pantry’s Acquisition of 21 Hy-Vee Fast & Fresh Stores

Prices Are Rising — But Why Retailers Are Feeling More Pressure Than Consumers
Explore More

Trusted By Many
Become A Part Of It


